
Compare the volume of entire price movements
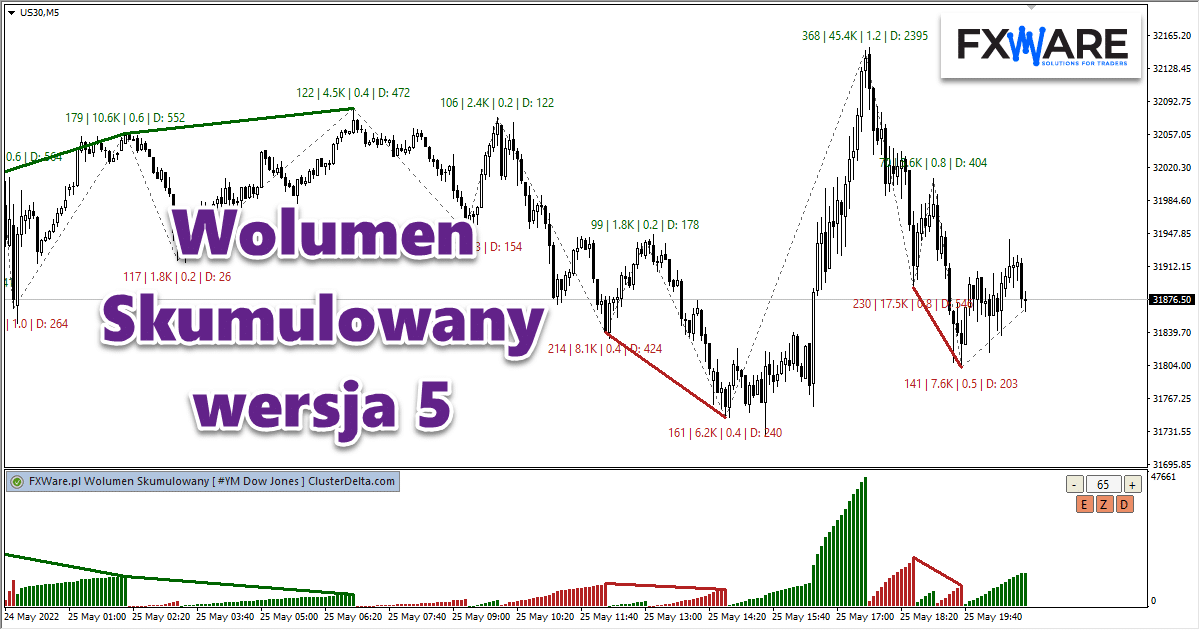
Individual volume bars do not immediately show how much activity has built up across the entire trend. Cumulative volume It totals the volume of successive swings and displays it as waves in a separate window below the chart. This makes it easier for you to compare successive upward and downward trends.
This tool is designed for traders who analyse price action and wish to supplement their analysis with volume data. The product is available for MetaTrader 4 and MetaTrader 5.
From price movement to wave analysis
- Add an indicator to the chart. To begin with, it will automatically select the minimum swing length based on the ATR.
- Adjust the level of detail in the analysis. Adjust the wave length to observe shorter-term movements or the broader market structure.
- Compare the completed swings. Check the volume associated with each subsequent impulse and how it changed in relation to the price range.
Find out when price and volume stop moving in tandem
Imagine two consecutive upward price movements. The second one establishes a higher price peak, but is accompanied by a smaller surge in volume. The indicator may flag this discrepancy as a divergence, in accordance with the set price and volume difference thresholds.
On the chart, you can therefore compare a specific price movement with the activity that accompanied it, without having to manually add up the volume of successive candlesticks.
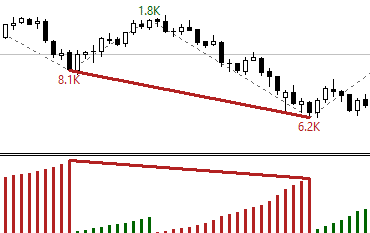
View the information you need for your analysis
- Wave labels: cumulative volume, range in pips and the volume-to-pips ratio. With ClusterDelta data, you can also enable delta.
- Swing lines: The optional ZigZag makes it easier to relate volume waves to the price structure.
- Panel on the chart: buttons
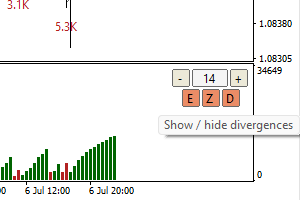
+i-change the wavelength, andD,ZiEcontrol the visibility of divergences, swing lines and labels.
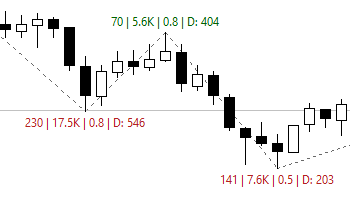
Select the volume source
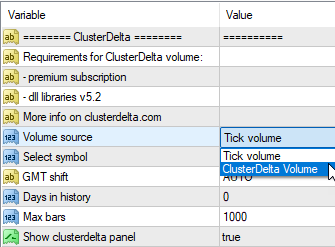
- Tick volume: the default data source from the broker. The product works with this source without the need for an additional data subscription.
- ClusterDelta volume: Optional data from the futures market. ClusterDelta is a third-party, paid service requiring a separate active subscription.
- MT5 actual volume: available in MetaTrader 5, provided the broker makes the actual volume for the instrument in question available.
You select the source in the parameter Source of volume. When comparing readings, bear in mind what data the indicator is based on.
Prepare your workspace
You will need a valid FXWare licence and a file FXW_CUMULATIVE_VOLUME.key. Extract the client package into the platform’s data folder, preserving the directory structure, restart the terminal and add the indicator to the chart. On first launch, tick Enable DLL import.
Frequently Asked Questions
Can I run two instances of the indicator on a single chart?
No. Only one instance of Cumulative Volume can run on a single chart.
Do I need to install the ClusterDelta libraries manually?
After switching to ClusterDelta volume The installer installs the necessary components and prompts you to restart the terminal. Then, link it to your ClusterDelta account in accordance with the product instructions.
How do I adjust the time period covered by the analysis?
Use the parameter Maximum number of candles for calculations (0=auto). A smaller range reduces the number of calculations, whilst a larger range allows more candlesticks to be included in the analysis.
What should you check if the pip values do not match the instrument?
Check the parameter Point-to-pip converter and adapt it to the pricing method used for the instrument in question.
How to interpret the results of the analysis
Waves and divergences describe the relationship between price and a selected source of volume. Divergence alone does not necessarily indicate a market reversal. Treat these indicators as part of your analysis, not as a recommendation to enter a trade.
Add volume context to your swing analysis
Check the current offer for ‘Cumulative Volume’ in the shop.