
Description
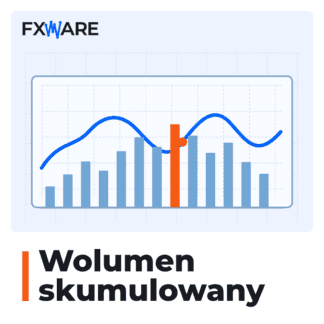
A combination of price movement and the volume of the entire swing
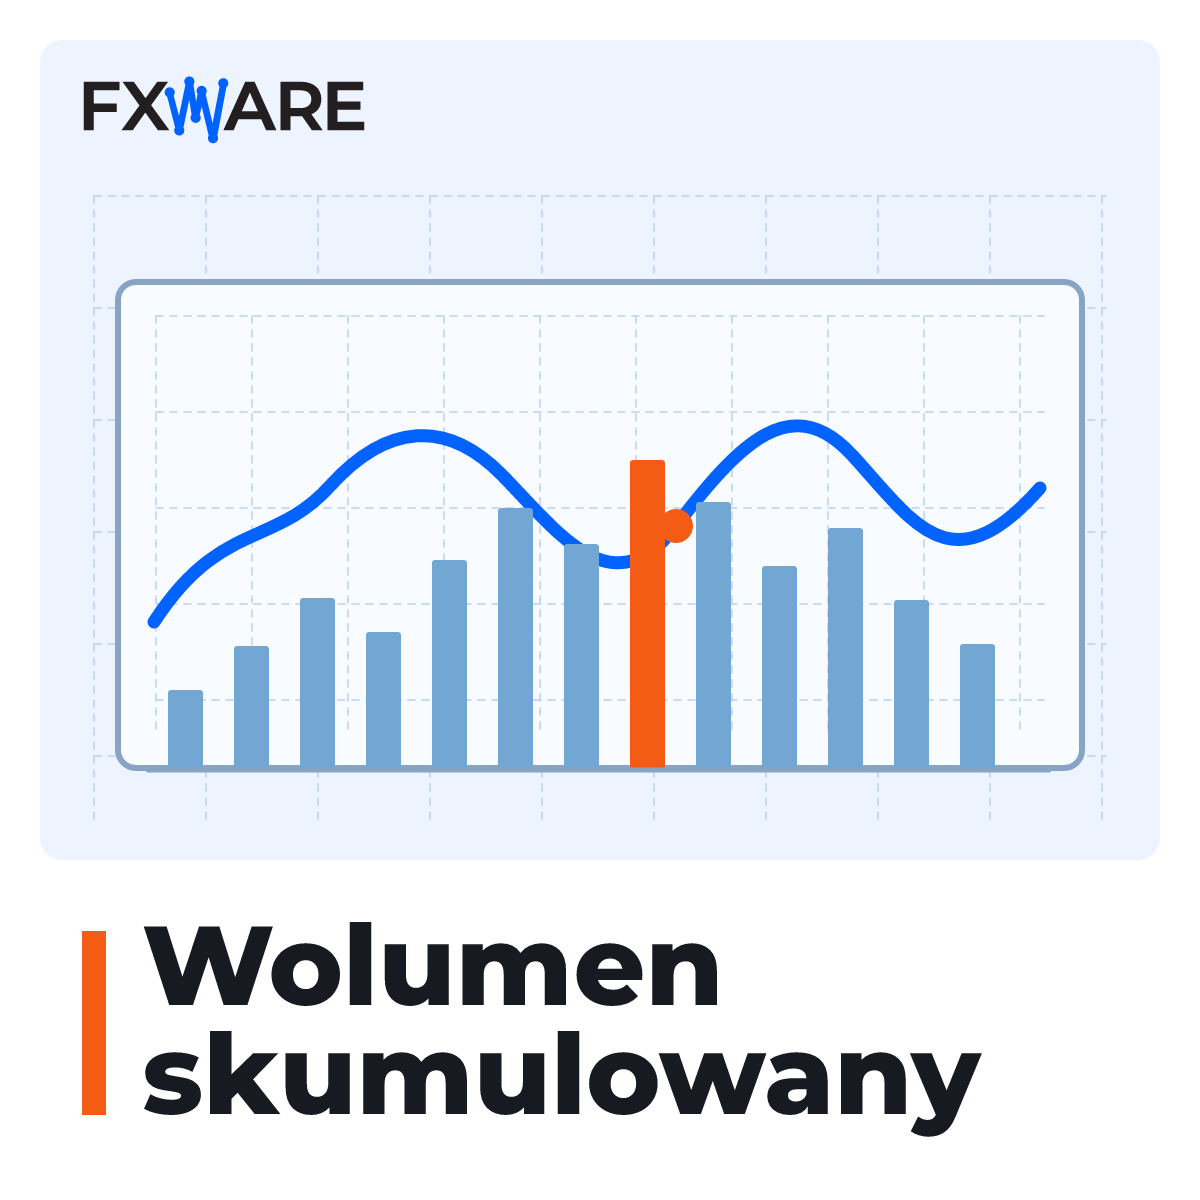
Cumulative volume aggregates the volume of successive candles within a single price movement. You get separate upward and downward waves, which you can compare with the price range.
How to use the indicator
- Add an indicator to the chart and check the automatically calculated swing length.
- Adjust the wavelength using the buttons
+i-. - Compare successive price spikes. A new price high accompanied by a decline in trading volume may be identified as a divergence.
Select the level of detail for the analysis
Enable labels showing volume, range in pips, or the ratio of volume to pips. With ClusterDelta data, you can also display the delta. Buttons D, Z i E allow you to show or hide divergences, swing lines and labels without opening the settings.
Data sources and launch
The product is available for MT4 and MT5. By default, it operates using tick volume data from the broker. ClusterDelta is an optional, paid third-party service providing futures data, which requires a separate active subscription. On MT5, you can also choose MT5 actual volume, provided the broker makes such data available.
To get started, you will need a valid FXWare licence and a file FXW_CUMULATIVE_VOLUME.key and consents Enable DLL import. Extract the entire package into the platform’s data folder, preserving the subfolders, and restart the terminal. Only one instance of the indicator can run on a single chart.
The limits of interpretation
A divergence highlights a discrepancy between price and volume. It does not in itself indicate a market reversal and is not a recommendation to enter into a trade.
Add ‘Cumulative Volume’ to your basket and supplement your price analysis with the volume of entire swings.