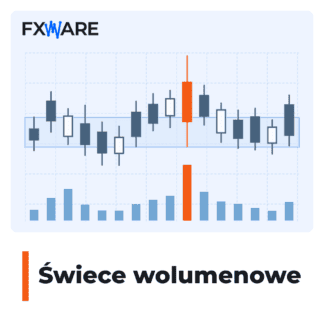
See the areas of increased activity on the chart
When analysing the price, it is easy to overlook a candlestick with a volume that is significantly higher than the average. Volume candles They highlight these candles and use them to mark out zones directly on the chart. This means you have marked areas that you can refer back to in your further analysis.
This is a tool for traders who use price zones and price action. The product is available for MetaTrader 4 and MetaTrader 5.

From the highlighted candle to the zone
- The indicator compares the volume with the average. It highlights the candles that exceed the set threshold.
- It defines an area based on the candle bodies. Subsequent candles detected that form a coherent area may be combined into a single zone.
- Awaiting confirmation of the course. A subsequent close above the upper boundary confirms the demand zone, whilst a close below the lower boundary confirms the supply zone.
- It extends the zone to the right. The area remains visible until it is invalidated, allowing you to monitor subsequent price movements.

Example: the price returning to a previously identified area
During a trading session, a candlestick appears with a volume exceeding the threshold. The indicator highlights it and defines an area based on its body or the bodies of a contiguous group of candlesticks. A subsequent close above this area confirms a demand zone.
When the price approaches the marked area again, you will already have its boundaries marked on the chart. Once the relevant alert has been enabled, the indicator can notify you when the price returns to the active zone, provided the conditions for a repeat notification have been met.
Customise the view and notifications
- Normal and strong zones: Separate volume thresholds make it possible to distinguish between areas that meet different detection criteria.
- Labels showing volume: Next to the zone, you can view the total volume of the candles that make it up.
- Two types of alerts: Select notifications for a new volume candle, the price returning to the active zone, or both events.
- Chart controls:
HIDE/SHOWchanges the visibility of candles and zones, andTURN OFF ALERTS/ENABLE ALERTScontrols notifications. Hiding the indicators does not turn off the alerts.
Start with the broker's data or choose another source
- Tick volume: the default data source from the broker. The product works with this source without the need for an additional data subscription.
- ClusterDelta volume: Optional data from the futures market. ClusterDelta is a third-party, paid service requiring a separate active subscription.
- MT5 volume: the broker’s actual volume available in MetaTrader 5, provided the broker makes it available for the instrument being analysed.
You select the source in the parameter Volume source. The data and the thresholds set determine which candles and zones will be highlighted.
Launch the indicator on your platform
You will need a valid FXWare licence and a file FXW_VOLUME_CANDLES.key. Extract the client package into the platform data folder, preserving the directory structure. After restarting the terminal, add FXWare_VolumeCandles_PL to the chart and select Enable DLL import.
The first time you switch to ClusterDelta, the indicator will install the necessary components and prompt you to restart the terminal. You should then link it to your ClusterDelta account in accordance with the product instructions.
Frequently Asked Questions
How can I limit the number of selected areas?
Lift Volume detection multiplier. You can also turn off Draw the usual zones and leave only the strong zones on the chart.
Can I keep the breached zones for historical analysis?
Yes. Turn it on Draw the negated zones, to keep these areas on the graph.
Can notifications be sent to my mobile phone or by email?
Yes. They require you to configure the relevant service in advance in the MetaTrader settings and to enable the selected channel in the indicator.
Will every return to the zone trigger an alert?
No. The price must first exit the zone on the correct side, and the set number of fully closed candles must have elapsed since the previous alert for that zone. If the price returns too soon, the indicator will not send a delayed notification later. The price must exit the zone again and then return to it.
What does the highlight on the chart mean?
A bold candle indicates that volume has exceeded the set threshold. It does not, in itself, determine the future direction of the price and does not constitute a trading recommendation. The term „strong zone” refers to a higher volume threshold, not a guarantee of a market reaction.