
Description
Track the zones resulting from above-average volume
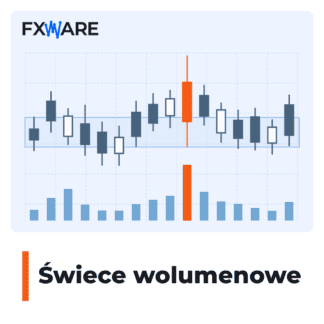
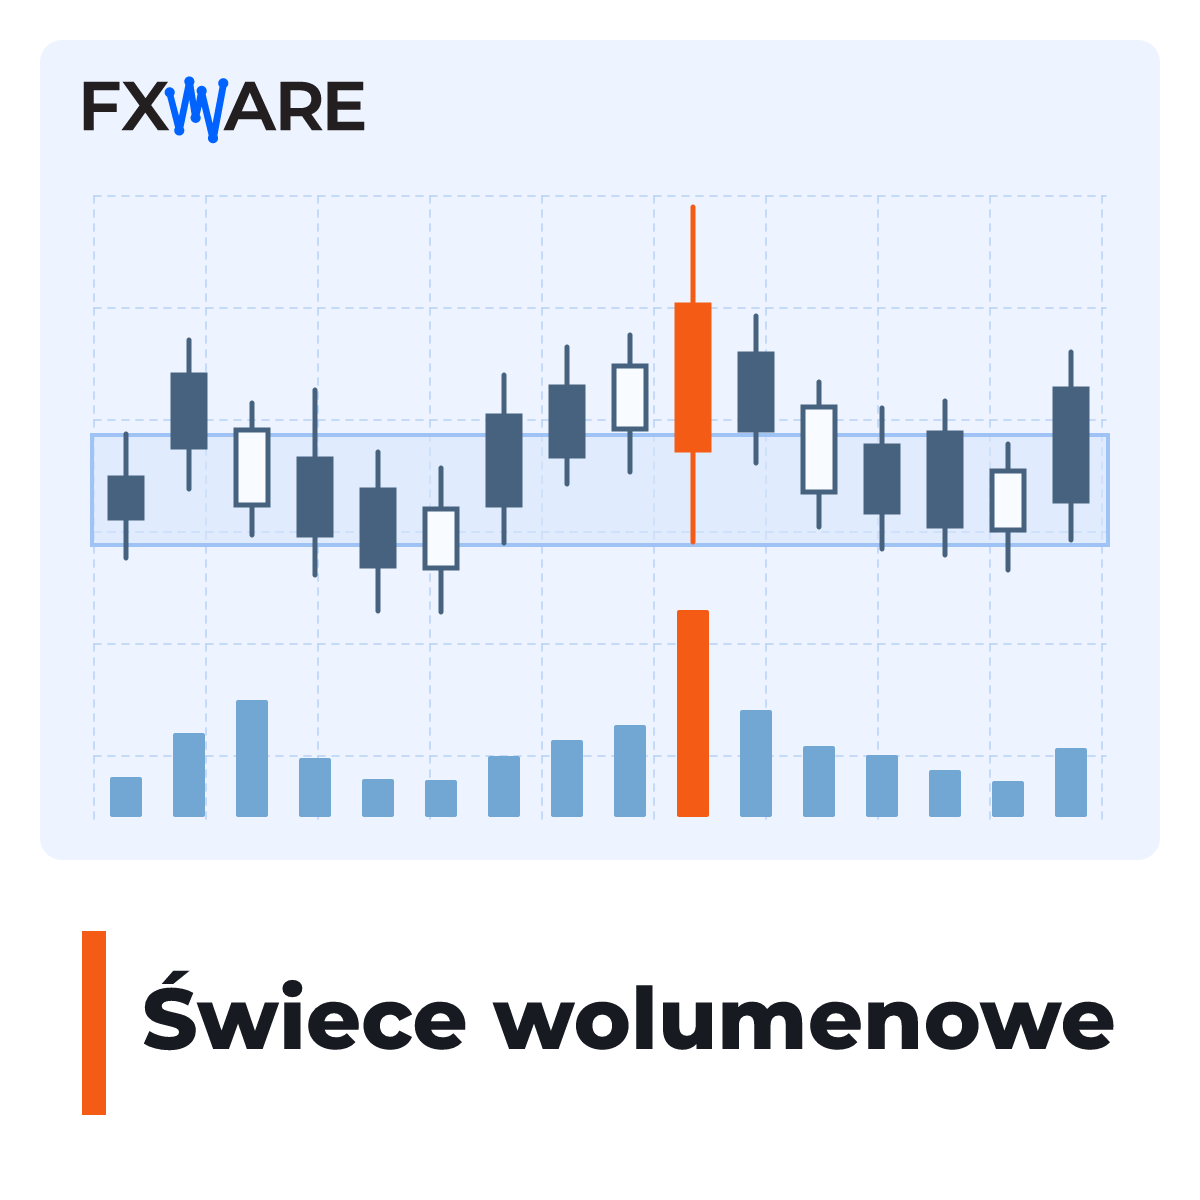
Volume candles indicate increased activity on the price chart. The indicator highlights candles that exceed the set threshold and identifies areas for you to monitor during further analysis.
How a zone is created
- The indicator compares the volume of a candlestick with the average and highlights those candlesticks that meet the condition.
- It creates an area from the bodies of the detected candles. A coherent group may be combined into a single zone.
- A subsequent close above this area confirms the demand zone, whilst a close below it confirms the supply zone.
Set up the view and alerts
Separate thresholds allow you to distinguish between normal and strong zones. The labels show the total volume of the candles making up the area. You can enable an alert for a new volume candle and for the price returning to an active zone once the conditions for a follow-up notification have been met.
Button HIDE / SHOW controls the visibility of the lights and zones. A separate button TURN OFF ALERTS / ENABLE ALERTS controls notifications. Hiding the indicators does not turn off the alerts.
Data sources and launch
The product is available for MT4 and MT5. By default, it operates using tick volume data from the broker. ClusterDelta is an optional, paid third-party service providing futures data, which requires a separate active subscription. On MT5, you can also choose MT5 Volume, provided the broker discloses the actual volume.
To get started, you will need a valid FXWare licence and a file FXW_VOLUME_CANDLES.key and consents Enable DLL import. Extract the package into the platform’s data folder, preserving the directory structure, and restart the terminal.
The limits of interpretation
A bold candle does not indicate the future direction of the price and is not a trading recommendation. A „strong zone” refers to a break above a higher volume threshold, not a guarantee of a market reaction.
Add Volume Candlesticks to your basket and add automatically calculated zones to the chart.